Interactive Mathematical Analytics
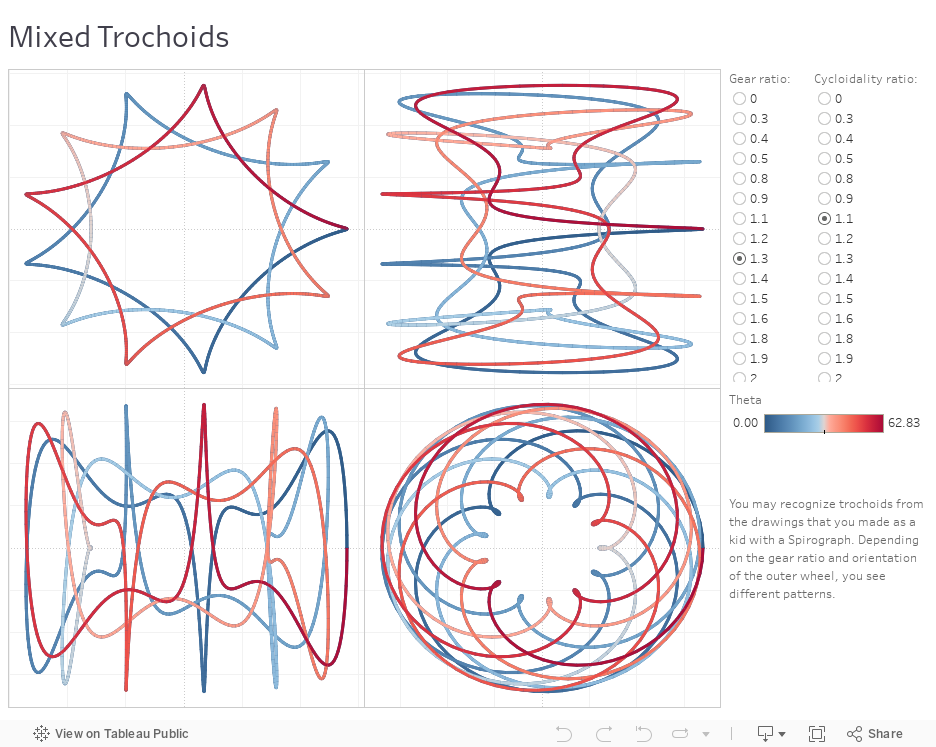
This workbook illustrates the family of curves called trochoids. To get a trochoid, fix a point on a circular disk (like a reflector in a bicycle wheel) and roll it along another circle. Using filters, dashboards, and drag-and-drop exploration, we can generate a variety of interesting curves with our back-end functionality. Tableau gives you the flexibility to visualize virtually any type of data.
Create and share on Tableau Public
Join the newsletter and find daily inspiration with the Viz of the Day. Yours could be featured next!

This is a womans world!
Get ready for a data-binge with #IronViz finalist Pata Gogová's #VizOfTheDay. Created on stage at Tableau Conference #Data24 Pata uses stacked bar charts, URL actions, filter controls, and more to explore industry gender representation and IMDb insights.
Interact with the viz