Telecommunications Analytics
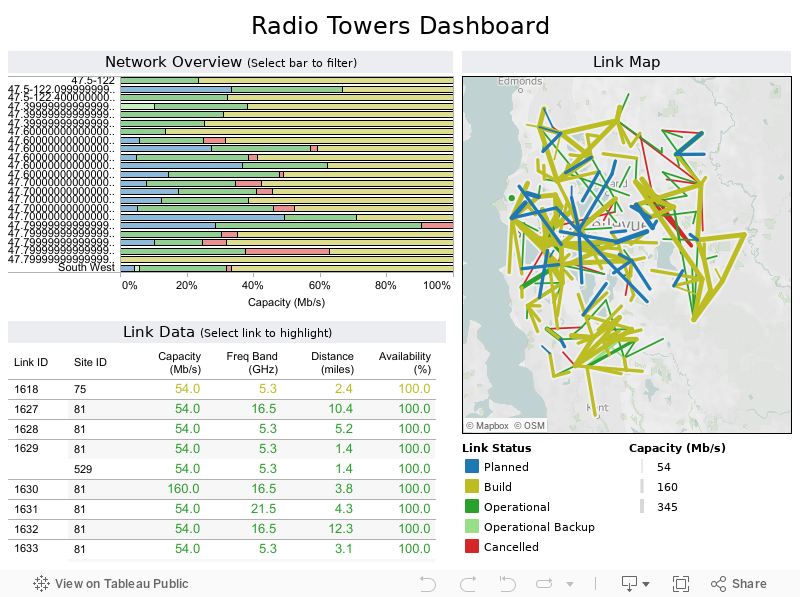
This broadband network was analyzed to evaluate future expansion sites and current performance. By clicking on a portion of the bar chart on the left, relevant site information is immediately displayed in the map and the detailed list below. Instead of creating hundreds of individual reports by site, the entire network can be evaluated in real time in one compact and powerful telecommunications analysis dashboard.
Create and share on Tableau Public
Join the newsletter and find daily inspiration with the Viz of the Day. Yours could be featured next!

This is a womans world!
Get ready for a data-binge with #IronViz finalist Pata Gogová's #VizOfTheDay. Created on stage at Tableau Conference #Data24 Pata uses stacked bar charts, URL actions, filter controls, and more to explore industry gender representation and IMDb insights.
Interact with the viz