Tableau public logo

Interact with public vizzes from around the world

Tableau Public is a free platform to explore, create, and publicly share data visualizations online.

Explore Public

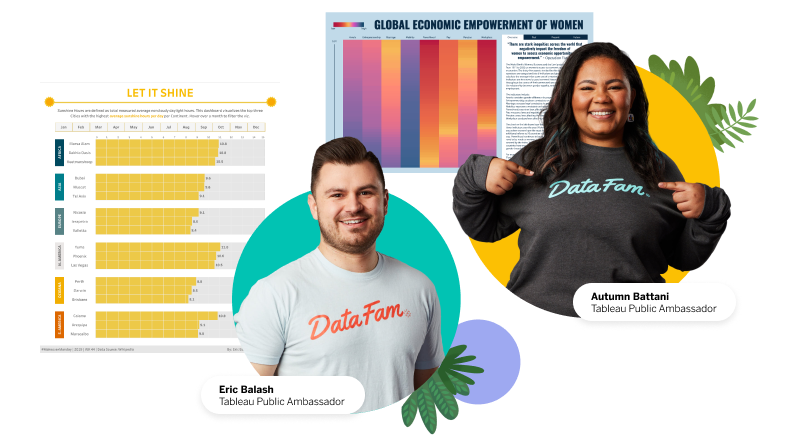
Marc Reid and Kimly Scott Tableau Public Ambassadors
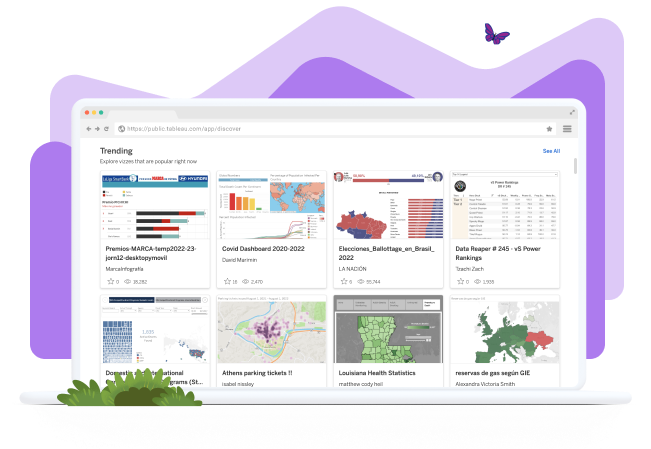
Tableau dashboard set in a laptop

Create. Explore. Share.

Looking to improve your data skills, get inspired, or grow your career? Create and explore data visualizations for free with Tableau Public as you build your own portfolio of work. Connect, share tips and tricks, and collaborate with data enthusiasts around the world.

How do I get started on Tableau Public?

DataFam Explained: What is Tableau Public?

Discover the magic of Tableau Public and take your data viz journey further with the help of the DataFam.

รับชมตอนนี้

Explore trending data visualizations on Tableau Public

Data visualization on Tableau Public

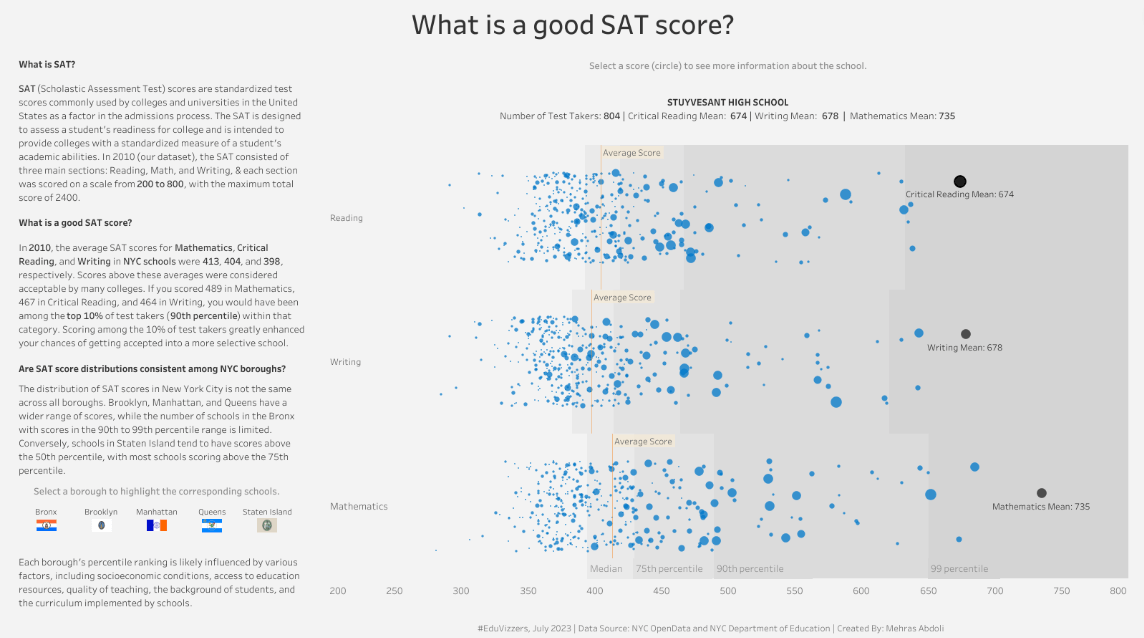
What is a good SAT score? by Mehras

A collaboration between community-led projects Back 2 Viz Basics (#B2VB) and #EduVizzers. This data viz visualizes the New York City SAT College Board results data using a scatter plot chart.

Sample Soft Drink Sales by Andy Kriebel 

Get an overview of product sales with this data viz on Tableau Public. Viz inspired by Priya Padham's Superstore Dashboard viz. 

Fertility Rates Across the World 2023 by Michael Fisayo Fajemilehin

Michael visualizes the fertility rates across the globe in 2023. Discover what country has the highest rate. 

See more

Tableau your mind. Daily.

Sign up for Viz of the Day, for your daily dose of creativity from the Tableau Community


This is a womans world!

Get ready for a data-binge with #IronViz finalist Pata Gogová's #VizOfTheDay. Created on stage at Tableau Conference #Data24 Pata uses stacked bar charts, URL actions, filter controls, and more to explore industry gender representation and IMDb insights.

โต้ตอบกับการแสดงเป็นภาพ

Check out these Tableau Public authors for inspiring visualizations

Tableau Public isn’t only a free platform for visualizing public data, it’s also where the Tableau Community can find limitless inspiration and learn from one another. Following Tableau Public Ambassadors helps you discover new topics, visualization ideas, and community activities.

Damola Ladipo

View profile

Damola Ladipo
Damola is a Data Visualization Specialist for USAID Data Services at DevTech Systems, Inc., where he develops dashboards and stand-alone maps, charts, and graphs. He became part of the Tableau Public community in 2020 and a featured author in 2021. Tableau Public serves as a space for him to draw inspiration for his vizzes and connect with the #DataFam Tableau community. When not working on his next viz, Damola enjoys watching sports, documentaries, and science fiction movies and shows. He also likes camping, baking bread, and reading historical and science fiction books and graphic novels..

Chiaki Ishida

View profile

Chiaki Ishida
Chiaki has been using Tableau since 2018. She soon discovered her passion for Tableau and data visualization. She is actively involved in #MakeoverMonday, #WorkoutWednesday, #VizforSocialGood, and JTUG(Japan Tableau User group) to further develop her data visualization skills. She strives to make viz simple and easy to understand, but occasionally contributes complex, challenging, and playful viz. She loves Tableau Public and the Tableau Community, which is always a great inspiration, and I would like to encourage more people in Japan to join.

Kasia Gasiewska-Holc

View profile

Kasia Gasiewska-Holc
Kasia is a senior marketing analyst at the London Stock Exchange Group (LSEG) and was introduced to Tableau three years ago. Ever since, she’s been hooked and captivated by the power of data visualization. She uses Tableau Public to connect with other like-minded people and translate creative thoughts into data stories. As a member of the #DataFam community, she loves to follow other data viz geeks, learn from them, and use their work as inspiration for projects. She is particularly interested in sustainability and environmental topics, but also enjoys vizzing about lighter subjects (e.g., music or TV series). With each project, Kasia tries to push the limits of what can be done with Tableau and she’s keen on implementing unique custom animations in her vizzes. Connect with Kasia on Twitter and LinkedIn.

Kevin Wee 黃克文

View profile

Kevin Wee 黃克文
Kevin is a PhD candidate at Purdue University, researching the impact of animation design on students' learning experiences. Tableau Public enables him to showcase his capability in visualizing data appropriately and creatively. It also allows him to share charts that he created for research with other collaborators, stakeholders, and researchers, for example. Kevin’s favorite parts of Tableau Public are the user-friendly interface—on both the app and online— and the immense amount of resources available. He started using Tableau Public last October, has participated in #MakeoverMonday, and was chosen as a Favorite of the Week ten different times. His favorite topics to viz include higher education and student learning. Connect with Kevin on Twitter and his website.

Brittany Rosenau

View profile

Brittany Rosenau
Brittany is a Sr. Analyst at JLL who believes everyone is better with equitable access to data. She is passionate about the good data viz can achieve in communities and businesses alike. Brittany was introduced to Tableau Public through an internal enablement program and has been hooked ever since. Learning from the vast repository of published content and participating in community data challenges are her top data pastimes. Her interests outside of flowcharts and color palettes include playing percussion, tending to her plants and aquariums, listening to podcasts, and dogspotting. She's lived in the Midwest, Seattle, and now sunny Florida where she still looks up every time she hears an airplane.

Priyanka Dobhal

View profile

Priyanka Dobhal
Priyanka is a technical lead at USEReady. She was introduced to Tableau in 2018 and instantly fell in love with the art of visualization. Tableau Public is like a blank canvas for her to paint and her favorite part is the ability to share and learn from the #DataFam community. She believes in "Vizing what you love" and is mostly seen creating visualizations on movies, music, and sports. She enjoys creating the data sets for her visualizations and actively participates in community initiatives such as #MakeoverMonday, #WorkoutWednesday and #IronQuest. Priyanka credits her learnings and growth to the community. Connect with her on Twitter and LinkedIn.

"I’m so inspired by the dashboards I find on Tableau Public. It really helps me see what’s possible and apply new techniques in my own work."

Priya Padham, Tableau Public Ambassador

Grow your career

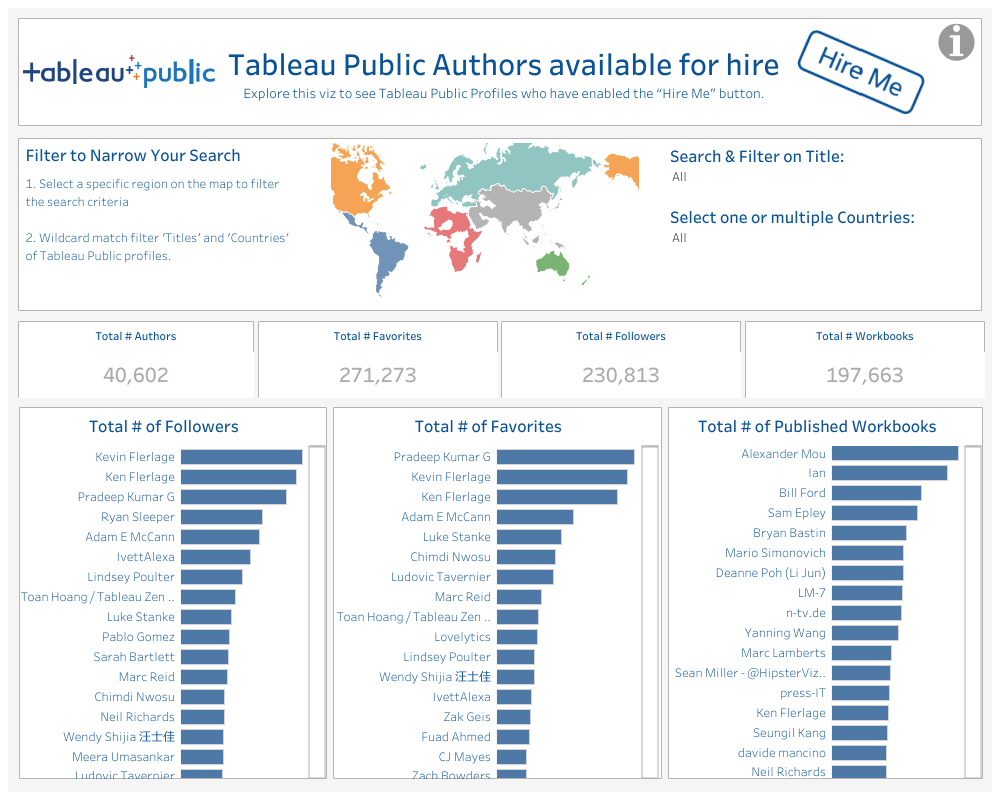
Stand out with your online analytics portfolio by enabling the Hire Me button. Learn how these Public community members used their attention-grabbing profiles to get noticed, advance their careers, and even source new data visualization job opportunities.
Zainab Ayodimeji

Zainab Ayodimeji

Tableau Public helped Zainab land her dream job at Spotify.

Learn more
Elisa Davis

Elisa Davis

Elisa built a Public portfolio that changed the trajectory of her career.

Read story
Idris Akilapa

Idris Akilapa

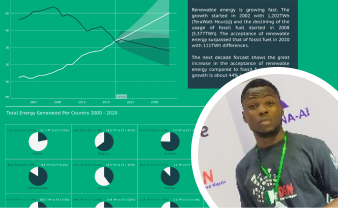
The Hire Me button helped Idris get a job offer—no applications required.

Get inspired

"The greatest thing about Tableau Public is that you have a visual portfolio of your work…I landed my dream job after working with Tableau Public for less than six months. It has truly changed my life and the lives of hundreds of others."

Kevin Flerlage, Tableau Public Ambassador

GET NOTICED

Expand your options

Enable the Hire Me button on your free Tableau Public profile to showcase your growth, areas of expertise, and more.

Join 50,000+ Tableau Public Authors who've built engaging profiles to get noticed, advance their careers, and connect with hiring managers.