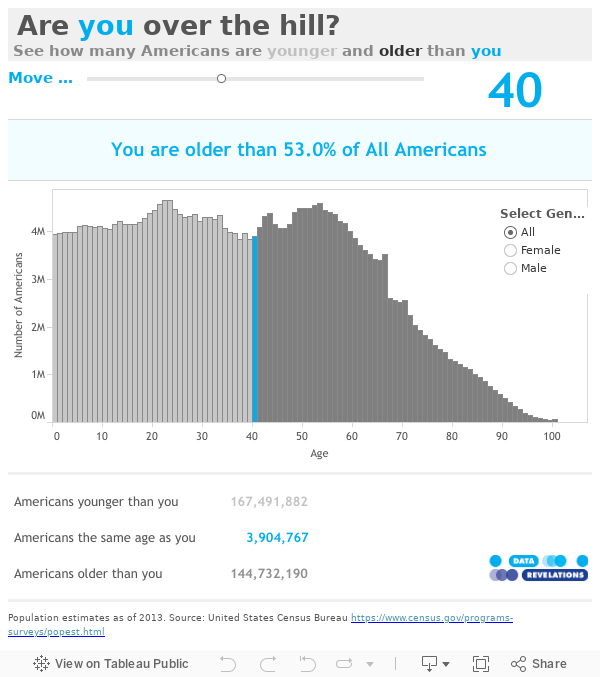
Are you over the hill?
This viz by Steve Wexler is the perfect example of making analytics simple, but not simplistic. Explore to see how your demographics compare with American ages and genders.
Create and share on Tableau Public
Join the newsletter and find daily inspiration with the Viz of the Day. Yours could be featured next!

This is a womans world!
Get ready for a data-binge with #IronViz finalist Pata Gogová's #VizOfTheDay. Created on stage at Tableau Conference #Data24 Pata uses stacked bar charts, URL actions, filter controls, and more to explore industry gender representation and IMDb insights.
Interact with the viz