Subscribe to our blog
Get the latest Tableau updates in your inbox.
 (4).png?itok=tN7YiLUq)
 Colten Woo
July 6, 2022

 Andy Cotgreave
July 12, 2019
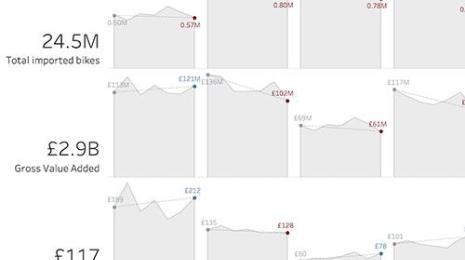
Welcome to the Best of the Tableau Web! To keep you going for another month, here are more tips, tricks, and inspiration.

 Andrew Beers
February 25, 2019
We’re excited to announce that we’re bringing our developer voice to the public with Tableau’s brand-new Engineering Blog!

 Jason Forrest
February 20, 2019
In celebration of Black History Month, we're taking a closer look at how Du Bois’s visualizations for the Paris Exposition were innovative.

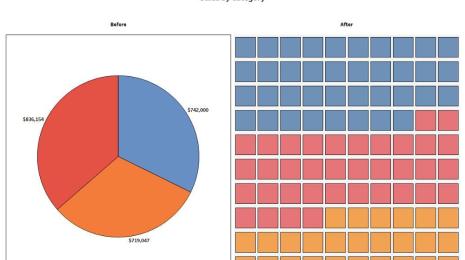
Before you bake another pie chart, consider these 5 alternative ways to visualize your data.

 Andy Cotgreave
July 13, 2017
This month’s roundup contains a host of great ideas, but I’m especially pleased to share all the “Creation Stories” behind many of the exceptional IronViz entries we received for the Safari Feeder competition.
 Jason Burns
May 23, 2017
Connect to your S3 data with the Amazon Athena connector in Tableau 10.3

Like any company, Tableau needs to make decisions about sales data. And as a data company, we’re always on the hunt for the best way to look at sales information. Here are five ways we look at our own operations to help make decisions about quota, territory management, and must-win deals.
 Andy Cotgreave
July 3, 2014
Stories have impact, create memories, and lead a viewer down a chosen path. Matt Francis explained when to use data stories in his TC On Tour session in London.
Get the latest Tableau updates in your inbox.